Tips for Studying with ICT

​​​​​​​The University of Maribor provides students and graduates with a uniform digital identity. With their username and password, students may access various services and tools.​

​​​​​​​​​​​​​​​​​​

The following are tips for active learning, organization of studies, preparation of innovative products and upgrading of knowledge using ICT.


​​​​​​​​Active learning

Using mind maps, concept maps, word clouds and flashcards can make your learning more efficient and faster.


Mind maps and concept maps

The main difference between a mind map and a concept map is in the structure. In a mind map, key words are surrounding the main word. The concept map is an illustration of the relationships between given concepts in the form of hierarchy. You can also include verbs that explain the relationship on individual arrows to make it easier to read and understand.​​​​

Structure of a mind map  Structure of a concept map
  Mind map                                   Concept map

Use:
  • Organized notes that encourage thinking about learning and facilitate the establishment of links between existing and new knowledge.
  • A dictionary of unknown or key words to which you add explanations (you can also use pictures).
  • Problem analysis, key steps to solve the problem and display of results (e.g., analysis of factors influencing sales).
  • Collecting ideas within the project work and co-creating a mind map or concept map (e.g., collecting ideas to plan the implementation of an event promotion).
  • Summary of the content and presentation of the key results of the findings (e.g., short report, presentation of the book author). 
ICT:

There are various tools for creating mind maps and concept maps. Mostly these are tools that are partially free. You can also create mind maps and concept maps with tools that were not originally designed to create them. With UM digital identity you can use: SmartArt (e.g., in Microsoft PowerPoint), Microsoft Whiteboard and ​Draw.io. Examples of other tools for creating mind maps and concept maps: CMapToolsDiagrams.netXmindCoggleMindMup and MindmasterWe recommend that in the case of partially free tools, you first check the options provided by the tool (due to the limited functionality of free versions) and start creating only then.


"The approach I use for learning creating a mental pattern. The latter is considered one of the most effective teaching techniques. I read the material and start creating a mental pattern. First, I write the main headings and graphically expand concepts from them that are key to knowledge and understanding of the material. The advantage of using such an approach is that in order to make a good mental model, you need to understand the material. Such a technique therefore encourages you to learn actively. Mind patterns are also a great tool for quick revision before an exam. One of the major disadvantages of such an approach is that the technique is time-consuming and difficult."

Second year student of the UM Faculty of Arts


​Word clouds

​Word clouds are a visual representation of selected words, ideas, or associations. You can illustrate their importance or frequency by the size or colour of individual words. Word clouds can be of different shapes, most often displayed in a circular shape.
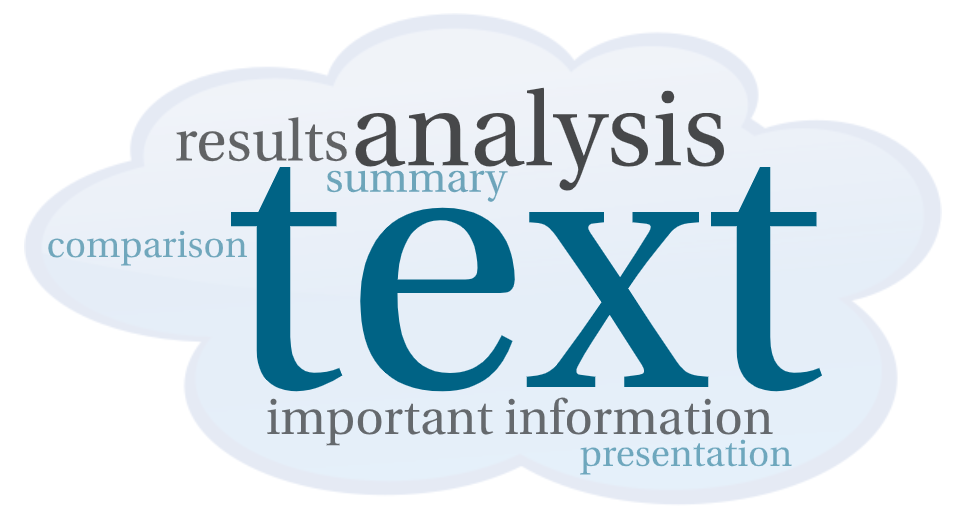

Example of a word cloud
Example of how to use a word cloud.

Use:

You can use the word cloud to present important information. You can also use it for:

  • analysis of words (e.g., show synonyms, antonyms and superlatives of the chosen word) or text (e.g., the most common words from Homer’s odyssey).
  • comparison of different types of texts (e.g., comparison of speeches).
  • a summary of the analysis of the results, with the most important data showing the most outstanding ones (e.g., the challenges in the field of ecology addressed by the respondents).


ICT:

There are the following free generators to create word clouds: Word ArtWordCloudsWordItOutTagCrowd.


Flashcards​​​​​​

Active learning can be performed using flashcards. Write a question or concept on one side of the flashcard, and an explanation, picture, etc. on the other side. The use of flashcards allows you to actively recall your knowledge when e.g. you look at the first side of the card with a term on it, because that’s when you’re trying to remember what that term means (instead of looking at notes). When you look at the other side of the card, you automatically compare your answer with the answer shown. You can also ask yourself How well or insufficient do I know the subject? This way you think more deeply about the content. Flashcards are designed to consolidate lower cognitive abilities (eg memory and comprehension) and promote improved memory performance.

Example of a flashcard

Use:

With flashcards you can consolidate: 

  • knowledge in the form of a quiz (question on one side of the card, answer on the other); 
  • acronyms (acronym on one side of the card, explanation of the acronym on the other side); 
  • new words (new word on one side of the card, synonym on the other side, which you can back up with an explanation);
  • understanding concepts (concept on one side of the card, explanation on the other); 
  • pronunciation of terms in a foreign language (term on one side of the card, voice recording on the other). 

ICT:

To create flashcards we recommend using the tool H5P.​

Organization and monitoring of progress

A successful study and work (individually or in groups) requires good organization and monitoring of progress. In doing so, carefully and promptly plan obligations, set priorities, divide tasks into smaller parts and set realistic deadlines. Written planning also relieves memory, and a written plan is motivating, as it makes it easier to stick to daily obligations.

An effective example of task planning is matrix planning, where tasks are divided according to importance and urgency. By doing this, you focus on the task that is most important and urgent. The division by priorities is similar (A = urgent, B = can wait a little, C = tasks that follow after A and B). Also, prepare a daily schedule and follow the performance curve to help you keep up with your pace.

Planning with a matrix

Last but not least, a self-evaluation is also important (e.g., in a checklist form), which allows for the adjustment of commitment planning and the pursuit of improved results and progress. Ask yourself the following questions:

  • Which part of the task I am most satisfied with?
  • Which part of the task I am least satisfied with?
  • Which part of the task was most challenging or incomprehensible to me?
  • Which skills, gained during the task, do I consider most important?
  • What would you change if you had more time to solve the task? Why? ​
You can also monitor the progress of what you have learned with the KWL method​, which promotes strategic learning.

Students of 1st and 2nd cycle University of Maribor study programmes that have an acitve student status in the current academic year, can access in web AIPS an infographic which makes it easier to monitor progress of the studies. The completed study path is shown with progress diagrams and badges for completed obligations. ​


ICT:

You can plan your obligations with: Microsoft PlannerMicrosoft To-DoH5P Documentation Tool and Asana.


Innovative products

During your studies, you often have to prepare of various products. You can prepare products in a more innovative way that e.g., create interactive presentations where you put yourself in the role of a teacher and encourage fellow students to participate. You can also create simple animations or a digital story.


An interactive presentation, which allow peer participation, can be done with the tool Mentimeter​. It is about creating transparencies with both - content and different types of questions. You can create a word cloud with your audience, and the results are displayed directly on the screen. You can also create a quiz or stimulate a discussion.
Word cloud with Mentimeter 
 

Example of a word cloud with the Mentimeter tool (feedback components)


​Simple animations can be done with Microsoft ​PowerPoint, where you prepare a sequence of transparencies with selected animations or effects and export them as GIFs. To create interactive reports, news, personal stories​ and a photo gallery, you can use  Microsoft Sway.

You can also record and edit your on-screen happenings or speech explanations (e.g., podcasts). To capture the screen, we suggest the tool Microsoft Teams and Microsoft Po​werPoint, for editing Shotcut)​. Bandicam  and Screencastify are available for capturing and editing screenshots. If you only need a snapshot of part of your screen, we recommend using the Windows Snipping Tool. For recording and editing you can use the podcast editing tool A​udacity.​

"I prepare notes for the learning material, read them out loud and record it with my phone or some other device. I can listen to the recording even when I don't have time to read the notes (eg while cleaning the room, while walking, instead of listening to music in the car, while sleeping). The disadvantage of this learning strategy is that it is not independent, so it is recommended to use other learning strategies at the same time. It is recommended to have notes in front of you while listening; this way, you can monitor the substance in physical form as well. The described learning strategy serves as a good enrichment of learning."
Second year student of the UM Faculty of Arts​


​The most commonly used information visualization is an infographic, with which you can present information in a useful, flexible and instructive way. You can display more complex relationships between information. We distinguish between different​​ types of infographics (e.g., anatomical, time series infographics, infographic CV).

Information infographic

Informati​on infographic


"I would call my approach to learning 'visualization = consolidation', because I remember things I see the most and can later recall them from memory in the form of pictures or visual representations. When taking notes, I try to present information in as many different ways as possible; in tables, paragraphs, in thought patterns, when I describe a process between different stages, I draw arrows... When I later learn from notes, I draw as many drawings as possible related to the material, because in this way I force myself to find as many associations as possible between new and old knowledge, and at the same time it helps to visualize the material."

Lara Paul, second year student of the UM Faculty of Arts​


Recommendations for creating an infographic: The infographic should contain up to 400 words. Show the words with visual elements. Pay attention to the use of colour combinations, using colour schemes or generators (e.g., C​oolors).

If you have chosen three colours, it is recommended to dedicate 60% of the space to the primary colour, 30% to the secondary colour and 10% to the tertiary colour. There are also many different templates for creating infographics online that you can follow.


Check which ICT is appropriate to create an infographic for your needs: 

Free licensed icons and images can be found at: 

Zadnja sprememba: 25. 07. 2024 10:58